Urban Sound Classification using Machine Learning: Results
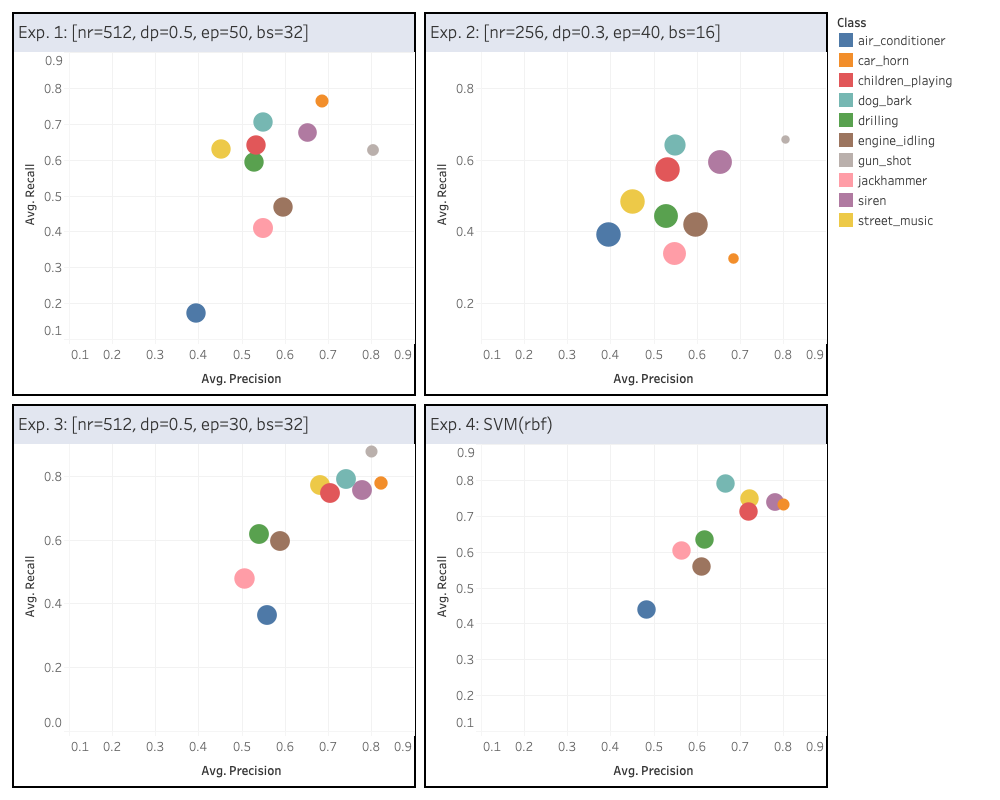
Stating the final result first, the dashboard image drawn
by Tableau is below. For Experiment 2 and 3, we selected the
one set of parameters which gave the best average accuracy of
four accuracy values. Here, experiment 2 takes non-scaled sample but
the experiment 3 takes standardized sample. The result is interesting
because Experiment 2 input has all MFCC information but the accuracy is
worse than Experiment 3. The result shows SVC model provides better accuracy.
(nr: number of neurons, dp: dropout, ep: epoch, bs: batch size)
| Experiment | Sample | Model | Accuracy |
|---|---|---|---|
| 1 | Sample 1 (scaled) | Sequential(nr=512, dp=0.5, ep=50, bs=32) | 0.53 |
| 2 | Sample 2 (non-scaled) | Sequential(nr=256, dp=0.3, ep=40, bs=16) | 0.48 |
| 3 | Sample 3 (scaled) | Sequential(nr=512, dp=0.5, ep=30, bs=32) | 0.65 |
| 4 | Sample 3 (scaled) | SVC(kernel='rbf') | 0.66 |
Precision vs. Recall of Best Models

Class F1-Scores of Experiments
Detailed results of Sequential model
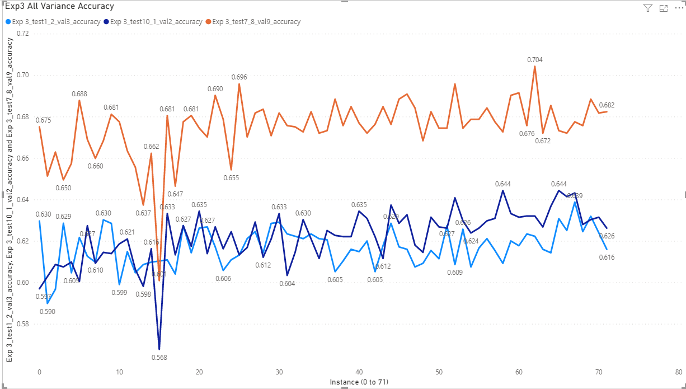
Instances in X-axis of the following charts
In training process using Sequential model, the parameters are selected
as the combination of the following values, which are 72 parameter sets.
- number of neurons = [64, 128, 256, 512]
- dropouts = [0.3, 0.4, 0.5]
- epochs = [30, 40, 50]
- batch sizes = [16, 32]
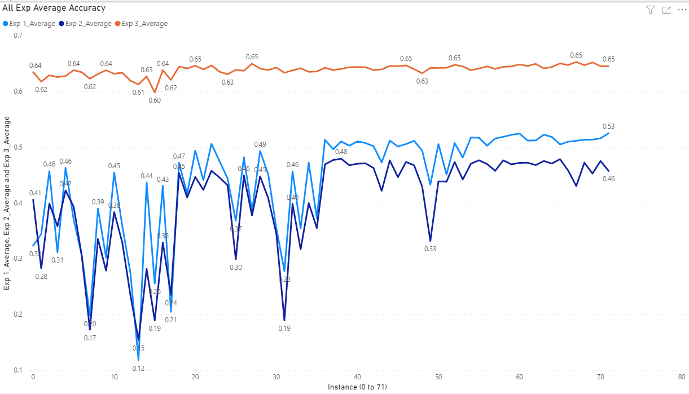
Average accuracy of Exp1, 2 and 3
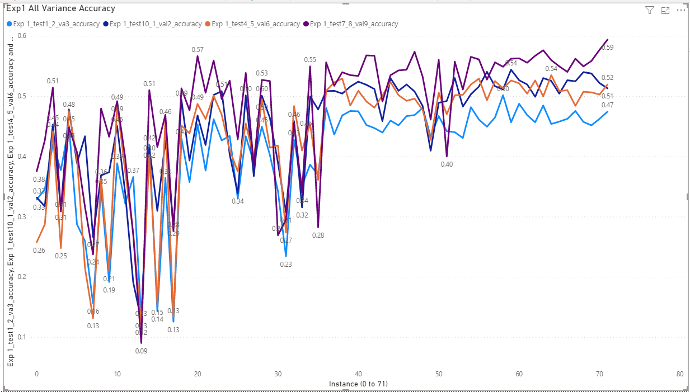
Experiment 1
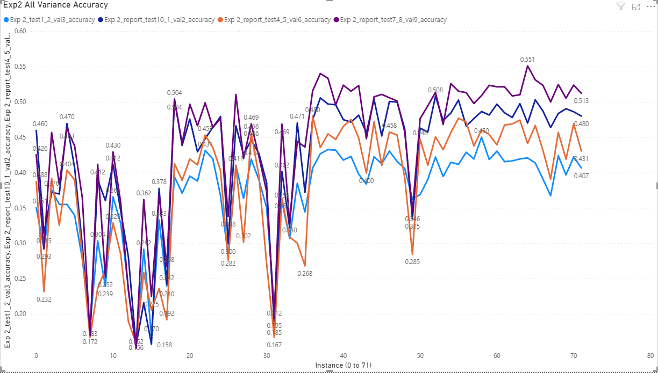
Experiment 2
Experiment 3
Eunjeong Lee, ejlee127 at gmail dot com, last updated in Nov. 2020